Kubernetes 1.36 apiserver /readyz now waits for watch cache
Test first. If you run production traffic, treat this as a control-plane behavior change, not a feature.
should you care? verdict
Yes, you should care. This changes when kube-apiserver admits it is ready, and your automation will notice.
In my experience, the worst control-plane outages start with a “green” health check and a pile of controllers doing list+watch at the same time. This release nudges the apiserver toward honest readiness. That is good. It can still bite you if your probes or load balancer health checks assume startup always stays under 10 seconds.
- Upgrade stance: test in a disposable cluster first. Watch your apiserver readiness time, restart count, and error rates after deploying.
- What breaks first: aggressive liveness or external health checks that kill the apiserver before it finishes warming watch cache.
- What gets better: fewer “Ready but actually not ready” windows that trigger thundering-herd list+watch traffic.
should you care? apiserver readiness waits for watch cache init (PR #135777)
You will see this. Your /readyz can stay red longer.
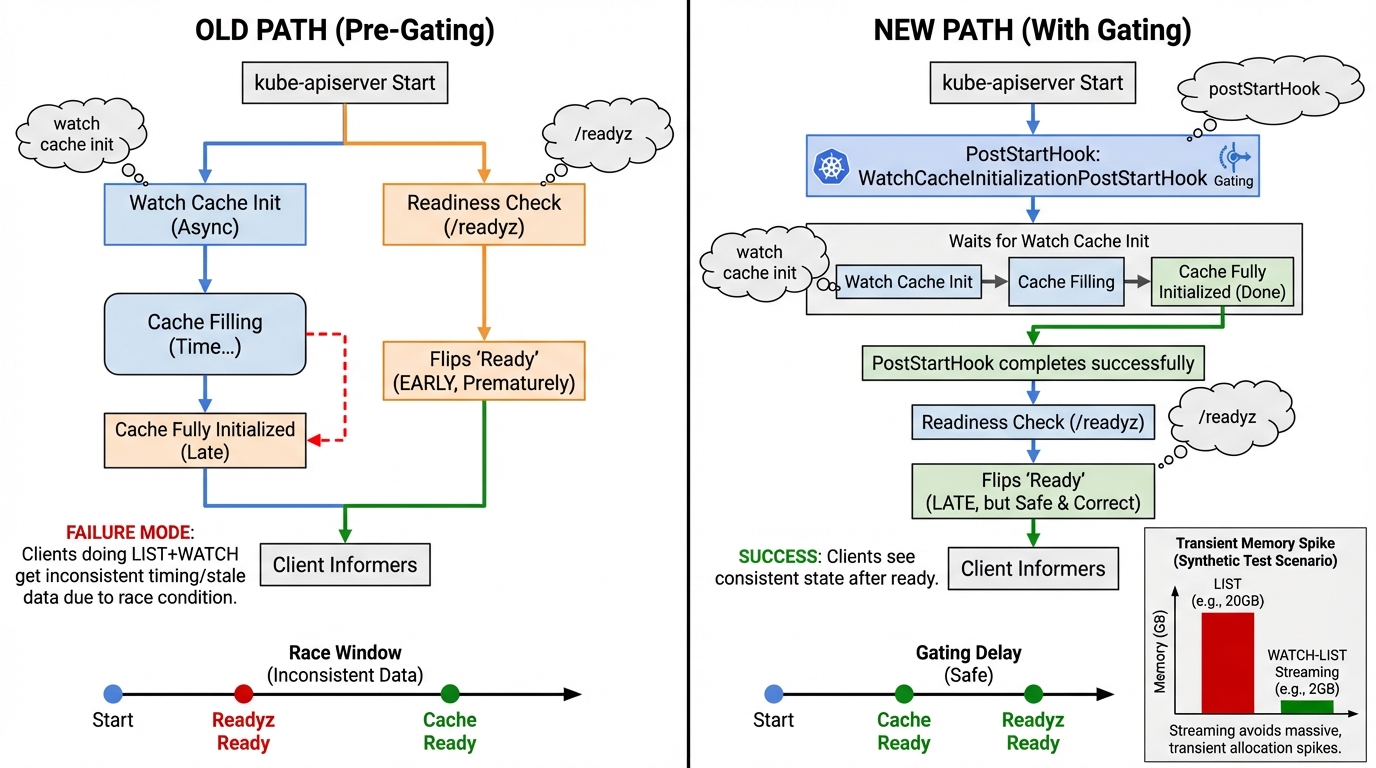
PR #135777 enables WatchCacheInitializationPostStartHook by default. kube-apiserver will not report ready until it initializes the watch cache, instead of letting it settle later. Read the PR if you want the gory details. It is a small default change with big operational side effects. Your mileage may vary depending on how large your cluster is and how noisy your controllers are.
Here’s the thing nobody mentions in release notes. A lot of “control-plane automation” treats slow readiness as a failure and responds by killing the pod. That works great until Kubernetes starts doing more work before readyz flips green. Then you get a boot loop you created yourself. I cannot point to an upstream “this will restart-loop you” bug report yet, so treat it as an operator risk. Still. I have seen enough probe configs to know it happens.
- What to monitor: apiserver restart count during rollout, and how long /readyz stays non-200 after a process start.
- What to check right after deploy: controller error rates and request latency. A thundering herd shows up as a fat tail on apiserver request duration and a spike in inflight.
- What to fix before blaming Kubernetes: any external load balancer health check that marks the apiserver dead faster than your slowest control-plane node can warm its caches.
should you care? watch_list_duration_seconds goes Beta (PR #136086)
This matters. You can alert on it without feeling silly.
PR #136086 graduates watch_list_duration_seconds to Beta. That gives you a more stable target for SLOs around watch-list behavior. If you run large informer fleets, or you have operators that “helpfully” relist the world every few minutes, this metric helps you stop guessing.
- Do this before testing 1.36: baseline watch_list_duration_seconds in your current version. Capture p50 and p95 for a normal day.
- Alerting posture: start with a paging threshold only if you already page on apiserver latency. Otherwise, route it to a ticket first and tighten later.
- After deploying: check your error rates after deploying, then check watch_list_duration_seconds. If both jump together, you found a real control-plane problem.
should you care? declarative validation can fail closed (PR #136117, KEP-5073)
Yes. This can turn a panic into user-visible 500s.
PR #136117 adds WithDeclarativeNative so strategy.go code can opt into DV-native validations. The sharp edge is intentional. When DV-native rules exist, generated validation code can run even if the DeclarativeValidation feature gate is disabled. If the authoritative declarative validator panics, Kubernetes fails closed and returns InternalError. That trades availability for correctness. In an API server, I agree with that trade most days.
- What you will see: InternalError on create or update, correlated with apiserver stack traces.
- What to monitor: apiserver 5xx rate by resource and verb. If your 5xx jumps right after upgrade, do not shrug and blame clients.
- Operational caveat: a fail-closed validator can block writes. Plan a rollback path for the control plane. Do not discover that during an incident.
should you care? list/watch memory spikes and the 10x swing
I have watched apiserver RSS climb for seven minutes straight. It looks like a leak. It usually is not.
The Kubernetes API streaming work shows why list behavior hurts under load. In a synthetic test from the upstream blog, kube-apiserver memory stabilized around ~2 GB with watch-list patterns enabled versus ~20 GB without. That is a test, not a promise for your cluster. Still, the direction matches what I see in real incidents. List-heavy clients punish apiservers with big transient allocations, then you pray the OOM killer picks the right process.
- What to monitor: apiserver RSS and allocation pressure during informer resyncs. Pair it with watch_list_duration_seconds so you can tell “slow watch-list” from “just memory churn.”
- What to do if it climbs: slow the rollout, reduce controller concurrency if you can, and check for misbehaving operators spamming list calls.
- Opinion: ignore GitHub commit counts. Watch your apiserver graphs.
should you care? how to test 1.36 alpha without ruining your week
Do it in kind first. Then do it again with your real monitoring.
The release schedule lists 2026-02-18 for 1.36.0-alpha.2. Schedules slip. Tags show up late. Verify the image exists before you assume it does. If you run kubeadm or a managed provider, you will wait for your distro anyway.
Use a disposable cluster. Keep it boring.
- Create a kind cluster: kind create cluster –name k136 –image kindest/node:v1.36.0-alpha.2
- Basic smoke check: kubectl cluster-info
- What to watch live: apiserver readiness behavior, restart count, and 5xx error rate during startup and during controller churn tests.
should you care? red flags and what I grep first
Page on symptoms. Not vibes.
If /readyz never goes green, look at watch cache init messages and then look at who kills the apiserver. If you see InternalError on writes, correlate timestamps with apiserver stack traces. If watch/list stalls show up, baseline watch_list_duration_seconds now that it is Beta-grade and compare during your canary. Your monitoring should tell you the story in five minutes, not after the postmortem.
Check your error rates after deploying. If you do not have an apiserver 5xx panel, you are flying blind.
Other stuff in this release: dependency bumps, some image updates, the usual. Anyway.
Testing the readiness change in a disposable cluster
Here are the exact commands to spin up a 1.36 alpha cluster and observe the new behavior:
# Create a kind cluster with K8s 1.36 alpha
# First, check if the image exists:
docker pull kindest/node:v1.36.0-alpha.2 2>/dev/null || \
  echo "Image not available yet — check https://github.com/kubernetes-sigs/kind/releases"

# Create the cluster
cat <<KINDEOF | kind create cluster --name k136-test --config -
kind: Cluster
apiVersion: kind.x-k8s.io/v1alpha4
nodes:
- role: control-plane
  image: kindest/node:v1.36.0-alpha.2
- role: worker
  image: kindest/node:v1.36.0-alpha.2
KINDEOF

# Verify it's running
kubectl cluster-info --context kind-k136-test
# Monitor apiserver readiness timing
# Watch /readyz endpoint during startup (restart the apiserver pod):
kubectl get --raw '/readyz?verbose' | head -20
# Time how long readyz takes to go green after restart:
# In one terminal:
watch -n 0.5 'kubectl get --raw "/readyz" 2>&1'
# In another terminal, trigger a restart:
kubectl -n kube-system delete pod -l component=kube-apiserver
# The key metric: how many seconds until /readyz returns 200
# With the watch cache change, expect longer startup on large clusters# PromQL queries for monitoring the new metrics
# Baseline watch_list_duration_seconds (now Beta):
histogram_quantile(0.95, rate(watch_list_duration_seconds_bucket[5m]))
histogram_quantile(0.50, rate(watch_list_duration_seconds_bucket[5m]))
# Alert on apiserver 5xx spike (catches declarative validation failures):
rate(apiserver_request_total{code=~"5.."}[5m])
/ rate(apiserver_request_total[5m]) > 0.01
# Monitor apiserver restart count:
changes(kube_pod_container_status_restarts_total{
namespace="kube-system",
container="kube-apiserver"
}[1h])
# Watch for the new readiness behavior:
apiserver_watch_cache_initializations_total# Clean up when done
kind delete cluster --name k136-testThe upstream PRs referenced: PR #135777 (WatchCacheInitializationPostStartHook), PR #136086 (watch_list_duration_seconds Beta), PR #136117 (Declarative validation fail-closed). For the full 1.36 release schedule, see the sig-release tracking page.
Track which versions are still receiving patches on our Kubernetes end-of-life dates.
Related Reading
- Kubernetes Upgrade Checklist — The runbook for safe minor version upgrades
- Kubernetes EOL Policy Explained — Know when your version loses support
- How to Add Version Health Badges — Track release health in your README
🔍 Free tool: K8s YAML Security Linter — paste any Kubernetes manifest and instantly catch security misconfigurations: missing resource limits, privileged containers, host network access, and more.
🛠️ Try These Free Tools
Paste your Kubernetes YAML to detect deprecated APIs before upgrading.
Paste your dependency file to check for end-of-life packages.
Plan your upgrade path with breaking change warnings and step-by-step guidance.
Track These Releases